
At its core, calculating electric motor efficiency is pretty straightforward: you divide the mechanical output power by the electrical input power. The result, expressed as a percentage, tells you exactly how well that motor is converting electricity into real, useful work.
Anything that isn't converted is lost, usually as heat.
Why Electric Motor Efficiency Is a Critical KPI
While the formula itself is simple, the number it gives you is one of the most important Key Performance Indicators (KPIs) you can track in any industrial setting. For plant engineers and maintenance managers, this isn't just some abstract figure—it’s a direct window into your operational health and financial performance.
A motor running at high efficiency means lower energy bills, reduced operating costs, and better equipment reliability. Simple as that.
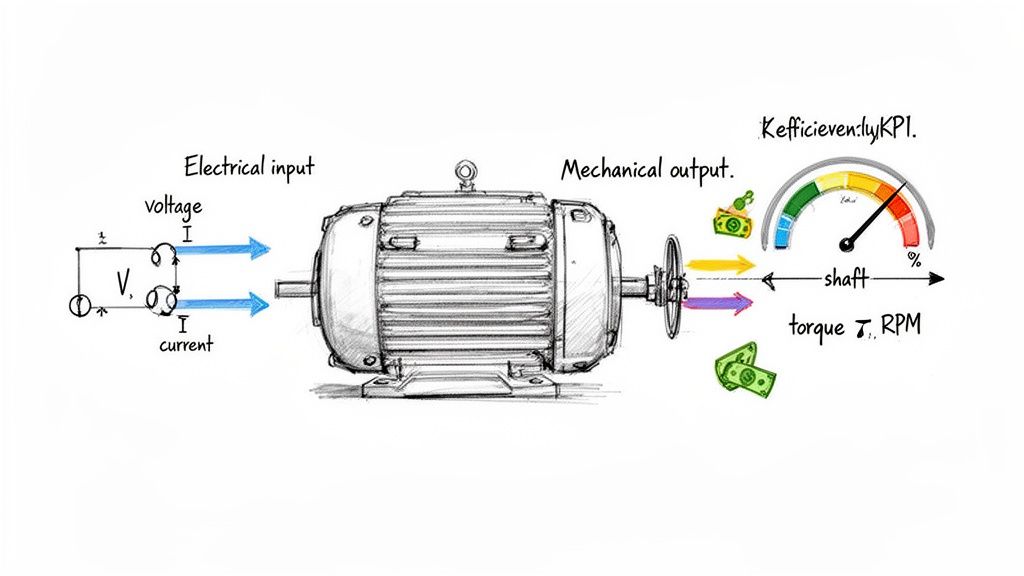
To really get a handle on this, you need to know the two sides of the equation:
- Electrical Input Power: This is what the motor pulls from the grid. Measured in watts (W) or kilowatts (kW), it's the product of voltage, current, and something called the power factor.
- Mechanical Output Power: This is the actual work the motor is doing at the shaft. You figure this out from its rotational speed (RPM) and the torque (rotational force) it's delivering.
The gap between these two numbers is where the waste happens. These losses are the enemy of an efficient operation.
Understanding Where the Energy Goes
Every single watt that doesn't help turn the shaft is wasted energy, and it almost always escapes as heat. This excess heat is what cooks a motor from the inside out, shortening its lifespan and setting you up for a premature failure.
The main culprits behind these energy losses are things like:
- Copper Losses (I²R Losses): These come from the natural electrical resistance in the motor's copper windings.
- Core Losses: Hysteresis and eddy currents create losses in the motor's magnetic steel core.
- Mechanical Losses: Good old-fashioned friction in the bearings and wind resistance (drag) from the cooling fan.
- Stray Load Losses: This is a catch-all for a bunch of other minor losses that are tricky to measure but add up as the motor's load increases.
The whole point of modern motor design and a solid maintenance program is to chip away at these losses. An inefficient motor isn't just an energy hog; it runs hotter, putting constant stress on its parts and making unplanned downtime a matter of when, not if. This is precisely why energy efficiency initiatives through strategic maintenance are so vital.
To give you a better grasp of what to look out for, here’s a quick breakdown of the factors at play.
Key Factors Influencing Motor Efficiency
The table below summarizes the primary elements that determine a motor's overall efficiency. It's a handy quick-reference for engineers trying to diagnose performance issues or specify new equipment.
| Factor | Description | Impact on Efficiency |
|---|---|---|
| Motor Load | The percentage of the motor's full-rated load at which it is operating. | Motors are most efficient near 75-95% of their rated load. Efficiency drops significantly at loads below 50%. |
| Motor Design & Quality | The materials used (e.g., copper vs. aluminum windings, quality of steel) and the precision of manufacturing. | Higher-quality materials and better designs directly reduce copper, core, and stray load losses. |
| Operating Voltage | The stability and level of the supply voltage. | Consistent, balanced voltage minimizes electrical losses. Under- or over-voltage can increase heat and reduce efficiency. |
| Maintenance | Regular lubrication, cleaning of cooling fins, and bearing checks. | Proper maintenance reduces mechanical friction and ensures the motor runs cooler, preventing heat-related losses. |
| Power Factor | The ratio of real power (kW) to apparent power (kVA) in an AC circuit. | A low power factor means more current is needed to do the same work, increasing I²R losses in the windings. |
Understanding these interconnected factors is the first step toward building a more robust and cost-effective operation.
The Financial Impact of Motor Inefficiency
The real-world dollar cost of poor motor efficiency is staggering. In developed regions like the United States and Europe, electric motors are responsible for a massive 40-50% of all industrial electricity consumption.
Even a small efficiency gain, when multiplied across a facility, can lead to huge savings. For example, just identifying and upgrading motors stuck in the 75-80% efficiency range can make a noticeable dent in your utility bills.
Think about a manufacturing plant with 500 motors. If you can boost the average efficiency from 85% to a premium level of 93%, you could slash annual energy costs by 15-20%. At an average electricity rate of $0.10/kWh, that one project could save the company over $100,000 a year.
This is exactly why knowing how to calculate motor efficiency is such a fundamental skill. It helps you pinpoint underperforming assets, build a business case for upgrades, and make maintenance decisions based on hard data.
Of course, other elements like the power factor play a big role in your overall electrical health. If you want to dive deeper, you can learn more about the power factor definition and its impact on your systems.
Gearing Up: The Right Tools for an Accurate Measurement
Before you even think about calculating motor efficiency, you have to be able to trust your numbers. And that trust comes down to one thing: the quality of your measurement tools. Using a basic multimeter when you need a power analyzer is like trying to do heart surgery with a butter knife—you might get a result, but you wouldn't bet a critical decision on it.
The whole game is about getting a crystal-clear picture of two things: the electrical power going in and the mechanical power coming out. Each side of that equation demands its own set of specialized gear.
Nailing the Electrical Input
First up, you've got to accurately measure the voltage, current, and power factor feeding the motor. This isn't a job for just any old clamp meter you have rattling around in your toolbox; the instrument has to fit the complexity of the job.
For a quick spot-check on a single-phase AC motor running under a steady load, a high-quality Digital Multimeter (DMM) with a clamp-on ammeter can give you a decent ballpark figure for voltage and current. It gets you in the neighborhood.
But for any serious efficiency audit—especially if you're dealing with three-phase systems or motors hooked up to a Variable Frequency Drive (VFD)—you absolutely must use a Power Quality Analyzer. There's no substitute.
A power quality analyzer is the non-negotiable tool for any professional-grade test. It measures voltage and current across all three phases at the same time, calculating the true power (kW), apparent power (kVA), and, most importantly, the true power factor. A standard DMM simply can’t do this, and relying on one will inject massive errors into your input power calculation right from the start.
When you're picking an analyzer, make sure it has these features:
- True-RMS Measurement: This is critical for getting an accurate read on the distorted, non-sinusoidal waveforms that VFDs kick out.
- Three-Phase Capability: It has to be able to watch all phases simultaneously to catch any imbalances.
- Data Logging: The ability to record data over a period of time is huge. It lets you see how efficiency shifts as the motor's load changes.
Without this level of instrumentation, your entire effort to measure efficiency accurately crumbles before you've even started.
Quantifying the Mechanical Output
Once you have a solid handle on the electrical input, it's time to measure what the motor is actually doing at the shaft. This means measuring its rotational speed and the amount of torque it's delivering to the load.
Measuring Rotational Speed (RPM)
The go-to tool here is a Tachometer. You’ll generally run into two types:
- Contact Tachometer: This has a small wheel or tip you press right against the end of the motor shaft. It's direct, simple, and gets the job done.
- Non-Contact (Photoelectric) Tachometer: This type uses a laser or an infrared beam aimed at a small piece of reflective tape stuck to the shaft. It's much safer for high-speed machinery or when the shaft is tough to get to.
For most fieldwork, a good handheld digital tachometer with an accuracy of ±1 RPM is more than enough to get the speed data you need for the output power formula.
Measuring Torque
Here’s where things can get tricky in the field. Measuring torque accurately often requires some pretty specialized equipment.
- In-Line Torque Sensor: These are installed right between the motor and the load, where they directly measure the rotational force. They're incredibly accurate but mean you have to uncouple the machinery, which makes them a better fit for a workshop or lab environment than a quick field test.
- Dynamometer: A dynamometer, or "dyno," is the gold standard for motor testing. It doesn't just measure torque and speed; it can also act as a programmable load. This lets you test the motor across its entire operating range and map out a beautiful, detailed efficiency curve.
Calculating Efficiency with the Direct Measurement Method
When you need hard, undeniable data on how a motor is really performing, nothing beats the direct measurement method. This is the gold standard for a reason. It involves simultaneously measuring the electrical power going into the motor and the mechanical power coming out of it while it's hooked up to a real-world load.
This approach takes all the guesswork out of the equation. It provides a clear, direct, and highly accurate snapshot of the motor's efficiency right then and there. What goes in must either come out as useful work or be lost as heat and noise. Direct measurement quantifies this relationship perfectly.
This diagram breaks down the basic setup for gathering the data you need.
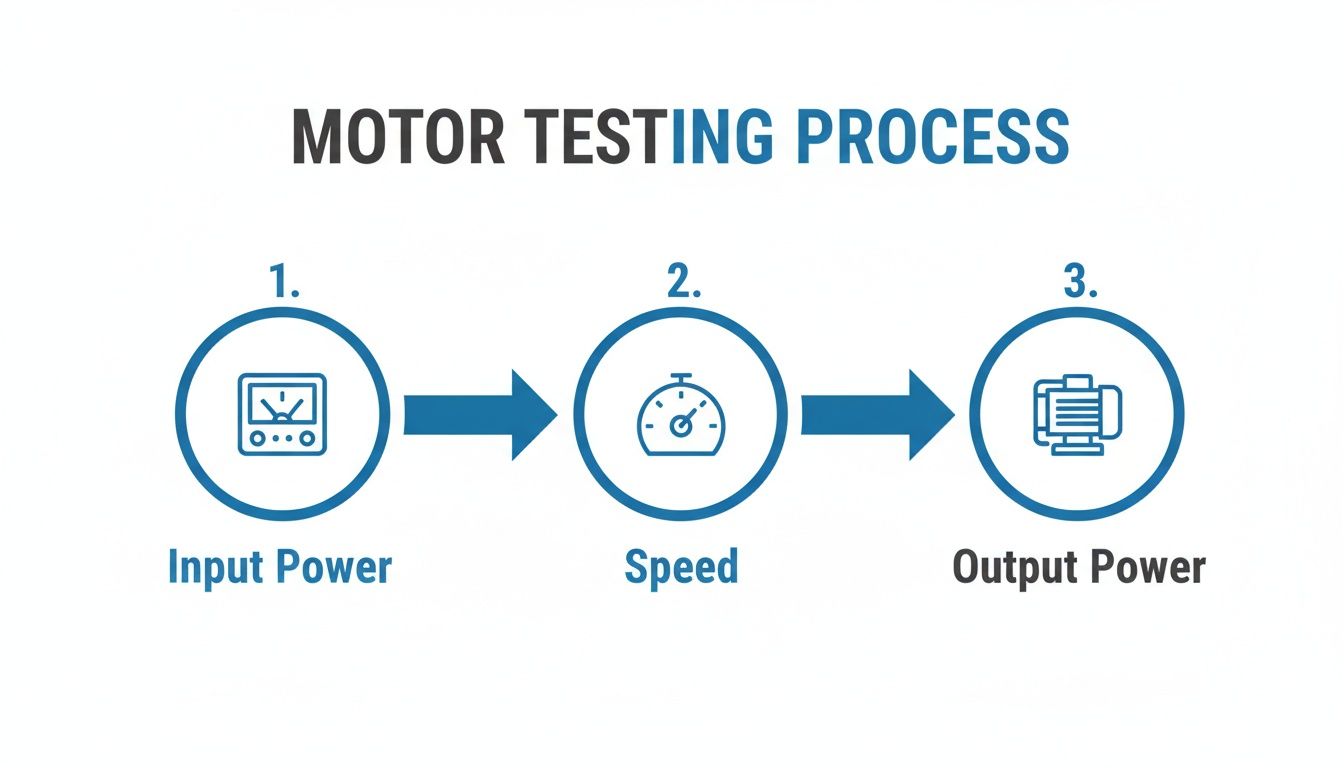
As you can see, you’ve got a power analyzer on the input side and a combination of a tachometer and a dynamometer on the output. This setup gives you all the variables needed for a rock-solid efficiency calculation.
Mastering the Input Power Formulas
First up, you need to nail down the electrical input power (P_in), which we measure in watts (W). The formula you'll use depends on whether you're dealing with a single-phase or a three-phase system—and in most industrial settings, you'll be working with three-phase.
- For Single-Phase Motors:
- P_in = Voltage (V) × Current (I) × Power Factor (PF)
- For Three-Phase Motors:
- P_in = Voltage (V) × Current (I) × Power Factor (PF) × √3
That extra factor, the square root of 3 (~1.732), is the magic number for three-phase calculations. It accounts for the phase difference in the power delivery. For the most accurate reading, make sure you're using the average line-to-line voltage and the average line current.
Measuring the Mechanical Output Power
Next, we need to figure out the mechanical output power (P_out). This is the actual rotational work the motor is delivering at the shaft, and it's a product of both its speed and its torque.
When you're working with standard imperial units, the formula looks like this:
- P_out (in Horsepower) = (Torque (lb-ft) × Speed (RPM)) / 5252
The number 5252 is a conversion constant that gets everything into horsepower. But to compare apples to apples, we need both input and output in the same units. That means converting horsepower to watts. Luckily, that’s easy:
- 1 Horsepower = 746 Watts
So, your final output power is simply P_out (HP) × 746. Now you have both P_in and P_out in watts, and you’re ready for the final step.
Bringing It All Together: A Worked Example
Let’s walk through a real-world scenario. You're testing a 50 HP, 460V three-phase motor that runs a big pump at a manufacturing plant. You’ve got your power analyzer hooked to the motor's input and a dynamometer on the output shaft.
You let the motor run for a bit to get up to a stable operating temperature, then you load it up and record the numbers:
- Average Line-to-Line Voltage (V): 462 Volts
- Average Line Current (I): 58 Amps
- Power Factor (PF): 0.88
- Shaft Speed (RPM): 1775 RPM
- Shaft Torque (lb-ft): 145 lb-ft
Alright, let's crunch the numbers.
1. Calculate Input Power (P_in):
Using our three-phase formula:
P_in = 462 V × 58 A × 0.88 PF × 1.732 = 40,841 Watts
2. Calculate Output Power (P_out):
First, let's get the horsepower:
P_out (HP) = (145 lb-ft × 1775 RPM) / 5252 = 48.98 HP
Now, convert that to watts:
P_out (W) = 48.98 HP × 746 W/HP = 36,543 Watts
3. Calculate Final Efficiency:
Efficiency (%) = (P_out / P_in) × 100
Efficiency (%) = (36,543 W / 40,841 W) × 100 = 89.5%
Our direct measurement shows this motor is operating at 89.5% efficiency under this specific load. This is why direct testing is so valuable—it’s not an estimate. It’s a definitive performance benchmark.
The Importance of Testing at Multiple Load Points
Here’s something a lot of people miss: a single efficiency number at full load doesn't tell the whole story. Very few motors run at 100% load all day long. Their efficiency changes dramatically depending on how hard they're working.
For a complete picture, you need to test at various load points—I always recommend 25%, 50%, 75%, and 100% of the motor's rated capacity.
When you plot these results, you get an efficiency curve. This curve is infinitely more useful for understanding real-world energy use. It will almost always show you that peak efficiency happens somewhere between 75% and 100% load, and it drops off a cliff below 50%. Knowing this helps you right-size motors for their jobs and avoid the classic, costly mistake of running a huge motor for a tiny task.
Using the Indirect Method for In-Service Motors
So, what do you do when you need a motor's efficiency numbers, but taking the equipment offline for a full dynamometer test just isn't an option? In the real world of a busy plant, you can't always shut down a critical production line. This is exactly where the indirect method, also known as the segregated loss method, proves its worth.
Instead of trying to measure mechanical output directly, this approach works backward. You start by accurately measuring the electrical power going into the motor. Then, you systematically track down and quantify all the internal energy losses. Whatever is left over after you subtract those losses is your useful mechanical output power.
The formula itself is straightforward:
Efficiency (%) = (Input Power – Total Losses) / Input Power × 100
This technique is a lifesaver for any maintenance manager or plant engineer who needs to assess the health of installed equipment without causing a major headache. It gives you a reliable efficiency figure for a motor that’s already hard at work, driving a pump, fan, or conveyor.
Breaking Down the Four Key Motor Losses
To get this right, you have to play detective and hunt down four distinct types of energy loss. Each one represents a different way the motor bleeds off electrical energy as something other than useful rotational force—mostly heat.
- Copper Losses (I²R Losses): These are the most common culprits. They're caused by the simple electrical resistance in the copper windings of the stator and rotor. As current flows, the windings heat up, and that heat is pure energy loss.
- Core Losses: These happen inside the motor's laminated steel core. They're a combination of hysteresis (energy lost from constantly reversing the magnetic field) and eddy currents (tiny, wasteful currents induced in the core material itself).
- Mechanical Losses: This bucket covers pure friction. We're talking about friction in the motor's bearings plus the "windage" created by the internal cooling fan and other spinning parts pushing against the air.
- Stray Load Losses: This is the catch-all category for a bunch of other complex losses that change depending on how hard the motor is working. They come from things like leakage flux and other secondary effects that are tricky to pin down but still contribute to the overall inefficiency.
By carefully segregating and adding up these individual losses, you can build a surprisingly accurate picture of the total energy going to waste.
The Testing Procedure for Segregated Losses
Pinpointing each type of loss requires a couple of specific tests. The two most important ones are the no-load test and the stator resistance measurement.
- Stator Resistance Test: This is a simple but absolutely critical first step. You'll use a high-precision ohmmeter to measure the DC resistance across the motor leads. This value is essential for calculating your copper losses (I²R) later on. A pro tip: make sure you do this when the motor is at a known, stable temperature, because resistance changes with heat.
- No-Load Test: For this one, you uncouple the motor from its load and let it run freely at its rated voltage and frequency. You measure the input power it's drawing. Since the motor isn't doing any real work, the power it's consuming is purely to overcome its own internal losses—the core losses and mechanical losses combined.
Think of it like a financial audit, but for watts instead of dollars. By combining the results from these tests with the input power you measure under normal operating load, you can piece together the motor's complete energy balance sheet.
Direct vs. Indirect Efficiency Measurement Methods
For engineers and managers deciding how to approach motor testing, understanding the pros and cons of each method is key. The direct method is the gold standard for accuracy but requires taking the motor out of service. The indirect method offers a practical alternative for live, in-service equipment.
Here's a quick breakdown to help you choose the right tool for the job.
| Attribute | Direct Method (Input-Output) | Indirect Method (Segregated Loss) |
|---|---|---|
| Accuracy | Highest (typically ±1%) | Very good (typically ±3%) |
| Equipment | Dynamometer, torque sensor, power analyzer | Power analyzer, ohmmeter, tachometer |
| Disruption | High (motor must be removed from service) | Low (can be done on an installed motor) |
| Best For | Lab testing, new motor acceptance, R&D | In-field diagnostics, energy audits, troubleshooting |
| Complexity | Mechanically complex setup | Electrically focused tests |
| Standard | IEEE 112 (Method B) | IEEE 112 (Method E) / IEC 60034-2-1 |
Ultimately, while the direct method provides the most precise answer, the indirect method delivers actionable data without shutting down your operations, making it an invaluable tool for real-world facility management.
The segregated loss method, which is rooted in standards like IEEE 112 and was refined by organizations like Ontario Hydro back in the 1980s, gives us a non-intrusive way to see what's happening inside. In fact, research shows its accuracy is typically around ±3%. That's a huge improvement over less reliable estimates. A 1995 ACEEE paper on motor efficiency testing methods is a great resource if you want to dig into the historical data.
A Practical Example with a 100 HP Motor
Let's walk through a scenario. You're tasked with assessing a 100 HP, 460V three-phase motor out on the plant floor. The nameplate tells you it should pull about 75 kW at full load. You run the segregated loss tests and get these numbers:
- Copper Losses (I²R): 5 kW
- Core Losses: 4 kW
- Mechanical Losses: 3 kW
- Stray Load Losses (estimated): 3 kW
Add them up, and your total calculated losses are 5 + 4 + 3 + 3 = 15 kW.
Since you measured an input of 75 kW, the actual mechanical output is 75 kW – 15 kW = 60 kW.
Now, you can calculate the real-world efficiency:
Efficiency = (60 kW / 75 kW) × 100 = 80%
That's a problem. A modern NEMA Premium motor of this size should be hitting 93.6% efficiency. This hard data gives you everything you need to build the business case for a replacement. The savings get even bigger when that motor is driving equipment where you can fine-tune the output. For more on that, see our guide on AC motor variable speed options.
Common Mistakes and Best Practices for Reliable Results
Knowing the formulas and having the right tools is a great start, but it's only half the battle. Out in the real world, the industrial environment is messy. It's full of variables that can—and will—throw off your measurements, leaving you with data that looks fine on paper but doesn't reflect what's actually happening.
Experience teaches you where the traps are. I've seen it time and again: avoiding a few common mistakes is what separates a truly meaningful energy audit from an academic exercise. This is the stuff that makes your results not just correct, but reliable.
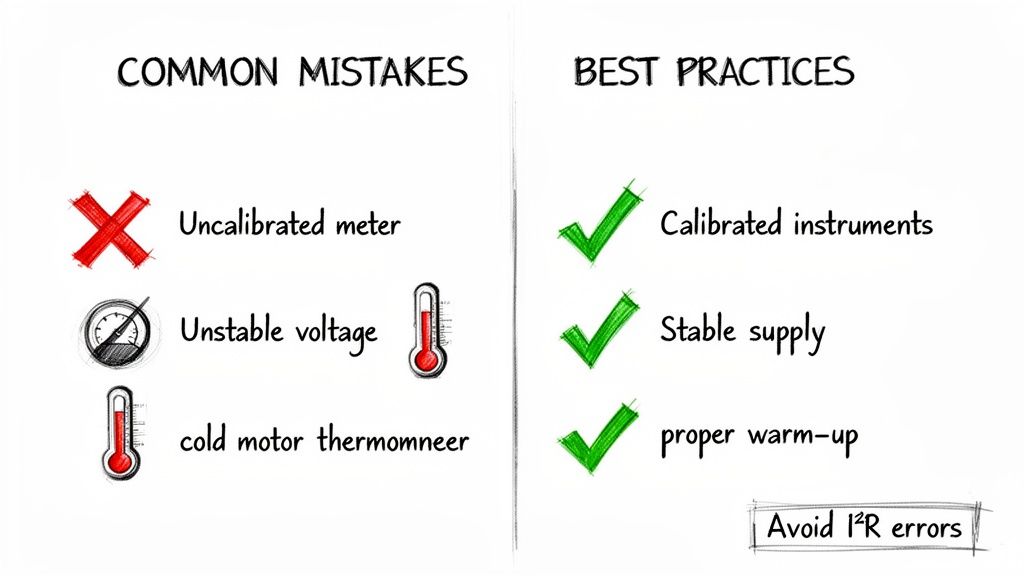
The Pitfall of Cold Testing
One of the most common blunders I see is testing a motor right after it's been turned on. A cold motor will give you misleading results every single time. Why? Because the electrical resistance of its copper windings changes dramatically with temperature.
As a motor runs, it heats up. That heat raises the resistance of the windings. Thanks to Ohm's Law, higher resistance means higher copper losses (I²R losses), which drags down the motor's real-world efficiency.
Best Practice: Let the motor run under its typical load for at least an hour, or until its frame temperature stops climbing. This "thermal soak" is crucial. It ensures your power readings reflect its true, steady-state performance.
Ignoring Your Instrument Calibration
This one should be obvious, but it’s surprisingly common. Using uncalibrated instruments is a recipe for disaster. A power analyzer that's off by just a couple of percentage points can create a cascade of errors, making your final efficiency calculation totally useless.
Think of it this way: your calculations are built on a foundation of numbers your tools provide. If that foundation is shaky, the whole structure you build on top of it will be worthless.
- Calibrate Regularly: Every piece of test equipment, especially your power analyzer and torque sensors, needs a valid calibration certificate. Stick to the manufacturer's recommended interval, which is usually once a year.
- Do a Sanity Check: Before a big test, I always try to do a quick check on a known, stable source if possible. It’s a simple way to confirm your gear is behaving as expected before you sink hours into collecting bad data.
- Document Everything: Keep a log of your instrument serial numbers and their last calibration dates. This is basic good practice for any serious quality or predictive maintenance program.
Understanding the Impact of Power Quality
Dirty power can wreak havoc on motor performance and completely skew your efficiency numbers. Things like voltage imbalance between phases, low voltage, or harmonic distortion from VFDs all force a motor to run hotter and less efficiently.
For example, a voltage imbalance of just 2% can crank up motor losses by nearly 20% and cause a serious temperature rise. If you miss this, you'll end up blaming the motor for poor performance when the real culprit is the power supply.
- Check Voltage Stability: Before you start, make sure the supply voltage is stable and within ±10% of the motor's nameplate rating.
- Measure Phase Balance: For three-phase systems, the voltage between each phase needs to be balanced. Anything over a 1% imbalance is a red flag that needs to be investigated.
- Use True-RMS Meters: This is non-negotiable. If there's a Variable Frequency Drive (VFD) in the mix, you absolutely must use a true-RMS power analyzer. A standard meter can't accurately read the messy, non-sinusoidal waveforms from a VFD, which will lead to wildly inaccurate input power data.
Following these field-tested practices ensures your efforts produce data you can actually trust and act on. If you ever run into performance problems you just can't pin down, getting a professional opinion is a smart move. You can learn more about specialized troubleshooting in our guide to electric motor service options.
Common Questions on Motor Efficiency
Even after you get the hang of the direct and indirect methods, a few practical questions always pop up. That's perfectly normal. Diving into the nitty-gritty of motor efficiency calculations always brings up some real-world headaches worth tackling head-on.
Let's walk through some of the most common questions we hear from folks in the field.
What's the Real Difference Between NEMA and IEC Standards?
This is a huge point of confusion, especially for teams sourcing equipment for international projects. At a high level, the National Electrical Manufacturers Association (NEMA) sets the bar in North America, while the International Electrotechnical Commission (IEC) standards are the global benchmark.
They’re chasing the same goal but use different language.
- NEMA keeps it simple with "Energy Efficient" and the higher-tier "Premium Efficient."
- IEC uses a numbered system, climbing from IE1 (Standard Efficiency) all the way up to IE5 (Ultra-Premium Efficiency).
While their testing methodologies are pretty similar, the actual efficiency targets for each class can differ. The most important thing is to know which standard governs your project. That way, you can specify—and later verify—the right motor for the job without any expensive surprises.
How Does a VFD Mess with My Efficiency Calculations?
Ah, the Variable Frequency Drive (VFD). It's a game-changer for control, but it definitely complicates your efficiency math. First off, the VFD itself isn’t 100% efficient. It has its own internal losses, usually burning off 2-5% of the power it draws. This means your total system efficiency (VFD + motor) will always be a few points lower than the motor's efficiency alone.
But the bigger issue is the VFD's output. It's not a clean, smooth sine wave like you get from the grid. This choppy, distorted waveform will completely fool a standard multimeter, leading to wildly inaccurate input power readings. You absolutely need a true-RMS power analyzer to get a correct measurement.
If you want to isolate the motor's true performance, you have to measure power at the VFD's output terminals—the lines running straight to the motor. Don't measure at the VFD's input. This is probably the single most common mistake people make when testing VFD-driven motors.
Can I Just Trust the Nameplate Efficiency Rating?
Think of that nameplate number as the motor's best-case scenario—achieved in a lab, under perfect conditions, at its full rated load. It’s a decent starting point, but you have to take it with a grain of salt in the real world.
Several things can drag a motor's operating efficiency well below what’s stamped on the side:
- Partial Loading: Efficiency plummets once a motor operates below 50% of its rated load. This is incredibly common.
- Voltage Imbalance: Even a small discrepancy between phases creates a huge drag on performance and generates excess heat.
- High Temps: A hot environment increases winding resistance, which directly translates to lower efficiency.
For any serious energy audit or a critical piece of machinery, there's just no substitute for getting your own field measurements.
How Often Should I Be Testing My Critical Motors?
There's no one-size-fits-all answer here, but the best practice is to build a testing schedule based on how critical the motor is. A great place to start is by getting a detailed baseline efficiency test done right after a new motor is commissioned.
From there, aim to re-test every three to five years. You should also make it standard procedure to test a motor after any major repair, especially a rewind. A sloppy rewind can easily slash efficiency by 1-2%, and you need to know if you're now running a less-efficient machine. Tying current monitoring into your condition monitoring program is another smart move—it can give you an early heads-up that performance is degrading and it's time for a closer look.
At E & I Sales, we provide the premium electric motors and integrated control systems that form the backbone of efficient industrial operations. From specification to commissioning, we help you build reliable, high-performance systems. Find out how we can support your next project.